Contractor Close Rate Optimization: How to Close More Jobs Without Lowering Your Price
Contractors often believe they have a lead problem. They assume that if the phone rang more often, their revenue would stabilize.
The reality is usually different. Most contractors have a close rate instability problem. Revenue fluctuation is structural, not random.
If you’re sending 10 estimates and only winning 3, your problem is not lead volume. Your problem is close rate. Busyness is not profitability, and close rate determines your revenue stability, margin protection, and crew utilization.
What Is Contractor Close Rate?
Close rate is the percentage of jobs won relative to estimates sent.
Jobs Won ÷ Estimates Sent = Close Rate
For residential finishing contractors, a healthy close rate sits between 40% and 50%. When that number drops into the 30% range, you have leakage. Below 30% is a system failure.
Why Contractors Lose Bids (It’s Rarely Price)
Contractors often assume they lost a bid because someone else was cheaper. While that happens, it is rarely the primary cause of a declining close rate.
More often, the loss is due to slower response times, inconsistent follow-up, or a failure to reduce uncertainty for the buyer. Silence from a prospect does not mean price rejection; it usually means indecision. And indecision is a structural problem that can be solved with a system.
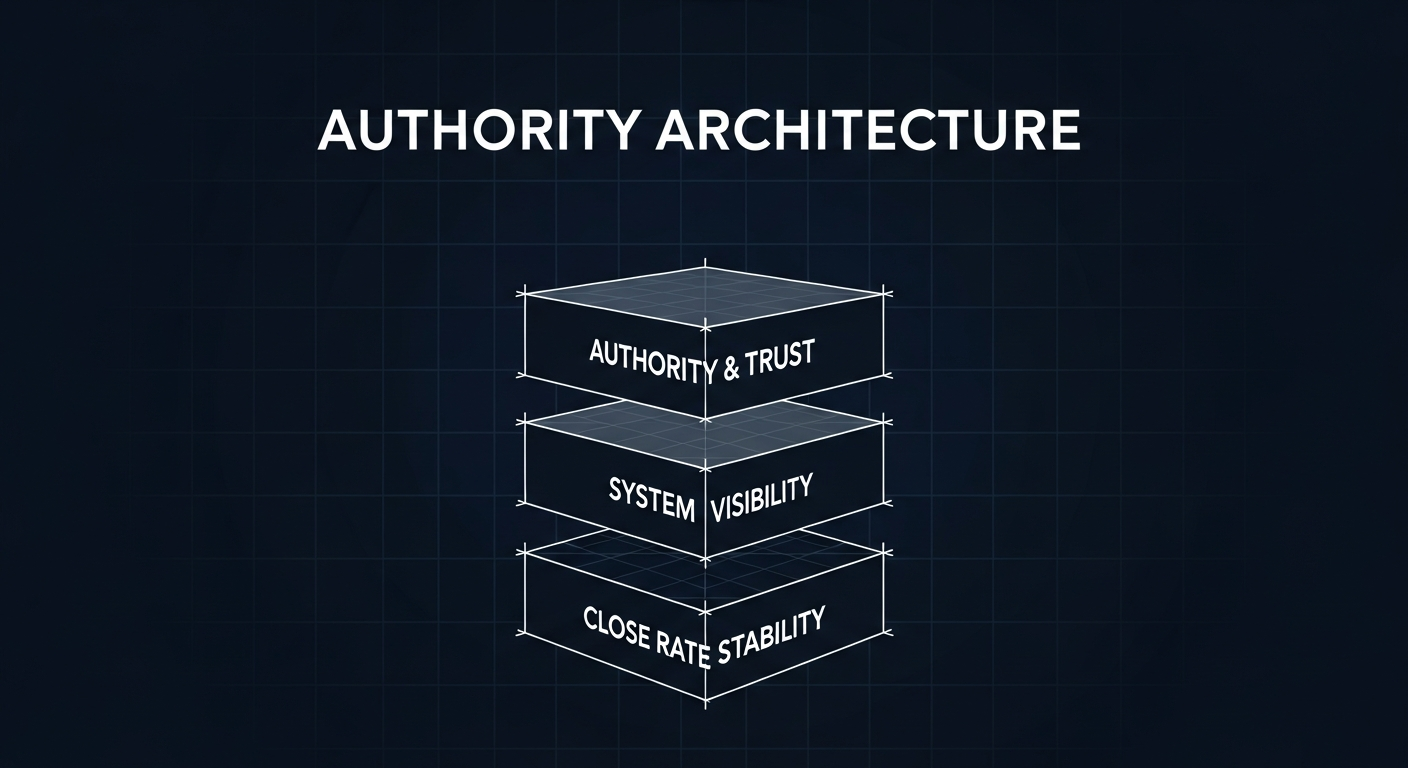
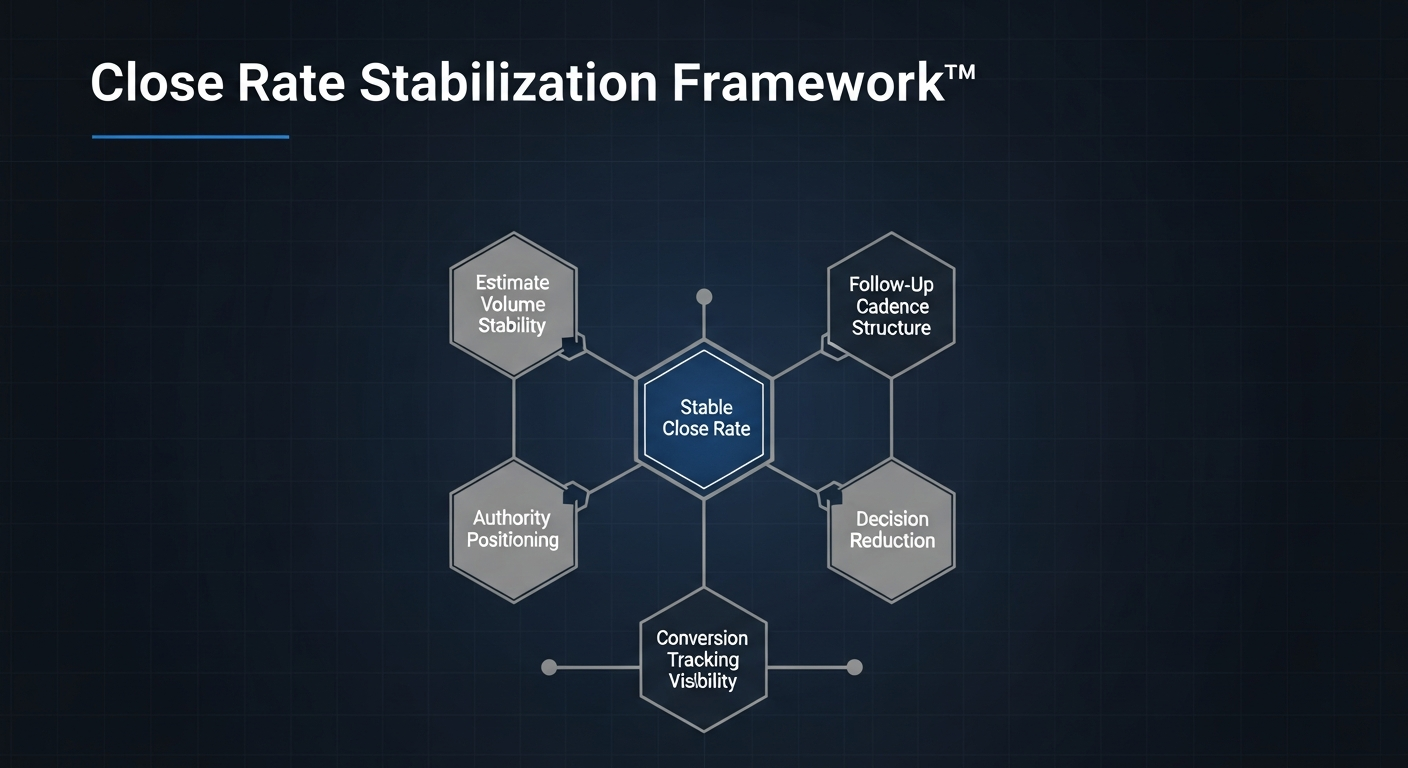
The Close Rate Stabilization Framework™
Close rate improves when you control these five variables:
1. Speed to First Response
If you respond within 10 minutes: Your close rate increases dramatically.
Why? Because the first contractor to establish trust controls the narrative. Speed communicates professionalism. Delay communicates uncertainty.
2. Pre-Framing the Estimate Visit
Before arriving: Confirm scope expectations, set timeline clarity, clarify decision-makers, and reduce unknowns.
When homeowners know what to expect, they relax. Relaxed buyers decide faster.
3. Authority Signals
Most contractors underestimate authority positioning. Authority includes: Before/after photos, testimonials, licenses & certifications, clear process explanation, and professional proposal formatting.
Google’s quality guidelines emphasize trust and reputation signals. Homeowners do the same. If you look organized, you are perceived as lower risk. Lower risk increases close rate.
4. Structured Follow-Up (Not Random Texting)
Close rate optimization depends heavily on follow-up cadence. Without structured follow-up: Close rate drifts downward silently.
With automation: Day 1 confirmation, Day 3 value reinforcement, Day 7 scheduling reminder, Day 14 soft close. Automation protects conversion. This is where CRM infrastructure matters.
5. Decision Framing (Psychology)
Instead of: “Just checking in…” Use: “We’re booking into next week — if you'd like to secure your spot, I can lock that in.”
This: Creates time boundary, signals demand, reduces procrastination, and avoids discounting. You are guiding a decision. Not chasing one.
The Real Cost of Close Rate Instability
The financial impact of a declining close rate is often invisible until it becomes a crisis. When close rate drops, you need more leads just to maintain revenue. That additional lead chasing costs more money, requires more time, and increases discounting pressure.
Monthly Scenario (20 Estimates)
45% Close Rate
9 jobs = $72,000
30% Close Rate
6 jobs = $48,000
Monthly Difference: $24,000
Annual Impact: $288,000
This is where margin compression begins. A low close rate forces desperation bidding and higher ad spend, eroding the actual profit of the business.
Financial Impact Diagnostic
Discover How Much Revenue Your Close Rate Is Leaking
Enter your numbers below to calculate your real annual revenue impact.
Most contractors discover $50,000–$200,000 in annual leakage.
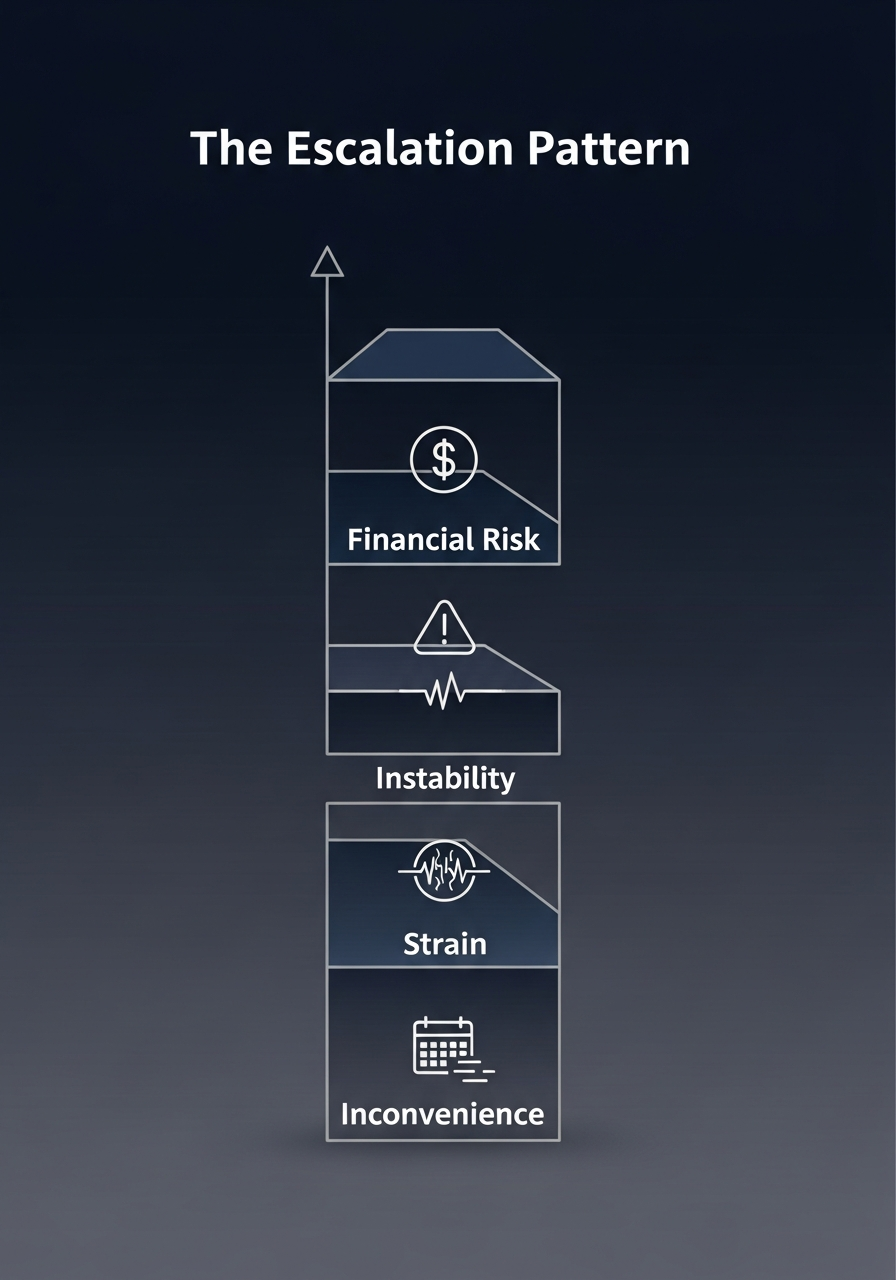
The Escalation Pattern
Declining close rates follow a predictable pattern of operational erosion that moves through distinct phases.
Inconvenience
Missed follow-ups feel like small administrative errors. You assume the client just wasn't ready or wasn't a good fit.
Strain
Lead volume must increase to hit revenue targets. This creates operational drag, increases marketing costs, and stretches your time thin.
Instability
Scheduling becomes reactive. Margins compress because you are spending more to acquire the same revenue, and crew utilization fluctuates.
Financial Risk
Cash flow becomes unpredictable. Payroll and vendor stability are threatened as the "feast-or-famine" cycle takes over the business.
How to Diagnose Your Close Rate Problem
If you suspect your conversion is leaking, ask these diagnostic questions:
- Do I track every single estimate in a centralized system?
- Do I know my exact conversion percentage for the last 90 days?
- Do I follow up consistently with every open quote?
- Do I automate reminders to reduce my own administrative load?
- Do I review lost bids monthly to identify structural patterns?
If the answer is no to three or more of these, you do not have a sales issue. You have a systems issue.
Why This Is a Financial Stability Issue
I have managed real crews and watched scheduling gaps appear the moment close rates dropped. It isn't just about sales; it is about operational risk management.
Contractor close rate directly impacts your payroll stability, vendor payments, and cash reserves. When close rates are unstable, your business becomes fragile. This is not motivational sales advice; it is the foundation of business sustainability.
About the Author
Tony Aponte has over 20 years of construction operations experience and 15+ years building contractor growth systems. His frameworks are built from firsthand contractor field experience and structured system implementation.